In 2020, the first year of the COVID-19 pandemic, the Hudson Valley experienced a population bump as city-dwellers fled upstate, seeking to escape dense urban areas.
The next year, as mask mandates were rolled back, vaccines were rolled out and schools eased back into in-person learning, that population gain didn’t continue, according a new report released by the non-profit Hudson Valley Pattern for Progress. It shows that in 2021 and 2022, the region experienced a net loss in residents due to migration, with the households moving in having higher incomes than those moving out.
The report analyzed a nine-county region comprising the counties of Columbia, Dutchess, Greene, Orange, Putnam, Rockland, Sullivan, Ulster and Westchester. The analysis is based on migration data released by the IRS, which is compiled from the ZIP codes attached to individual tax returns filed in 2021 to 2022.
“One of the things that we saw during the core of the COVID-19 pandemic is that the people moving into the region had incomes that far exceeded the people who were moving out,” said Adam Bosch, the president of Hudson Valley Pattern for Progress.
This trend continued into 2021 and 2022 in eight out of nine counties, according to the report. In Sullivan County, the average household income for those moving in was $77,994, while those moving out had the average household income of $72,985. This income gap was most pronounced in Greene County, where incoming residents had the average household income of $93,650, and outgoing residents had the average household income of $73,143.
Because of the higher incomes of residents moving in, five out of nine counties gained income — despite losing population due to migration outflow. Sullivan County’s population had a net loss of 55 people in 2021 to 2022, yet it still gained $11.2 million in income, according to the report.
“What the migration data often tell us is, even when we’re close to a break even scenario and the number of people doesn’t change, the constitution of those people changes,” said Bosch. “Our region is becoming a much greater proportion of metropolitan area expats, right? Traditional long-term residents are going.”
The report summarizes these trends more bluntly: “These data are irrefutable evidence of gentrification for some of our most rural towns and small cities,” it reads.
The Hudson Valley’s long-declining population has created a workforce shortage in the region, and with fewer pupils, several school districts have been forced to shut down buildings, according to the report. With higher-income residents driving up the cost of living, these problems may worsen, Pattern warns.
“Our communities now … are really wrestling, not only, with high interest rates, and high labor rates, and high land costs, and a lack of building for, like, 15 years. They’re now also wrestling with a market … that has responded to the influx of more wealthy households that are willing and able to pay more for housing, even if the general workforce and the average tenant or renter in the county is unable to pay more,” said Bosch.
Home prices have ballooned across the region — in Sullivan County, the median home price has nearly doubled from $141,250 in 2019 to $280,000 in 2023, according to another Pattern report.
When the IRS releases migration data from 2023 to 2024, the researchers at Pattern will be looking to see if the higher-income families that moved into the region stayed, said Bosch. With remote work, he continued, “it seems to us very likely that a larger proportion of the people who came here during the pandemic will stay.”
But in the meantime, the challenges created by pandemic-era migration warrant serious attention, said Bosch. “As that tension builds as a result of gentrification, what it does is it a lot pressure on policymakers, on lawmakers, on local elected officials to think about the laws and policies they could and should enact, [to] make sure that we have progress without displacement, wealth without displacement, right?”
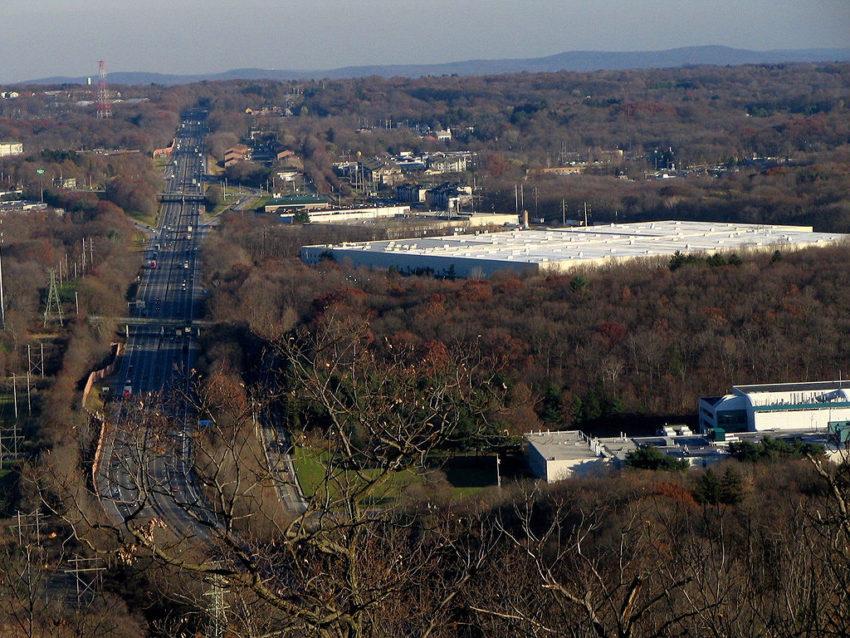
Photo: A section of the New York State Thruway in Suffern, NY. By Mwanner, CC BY-SA 3.0.

